Project Description
Total Revenue vs. Total Online Revenue
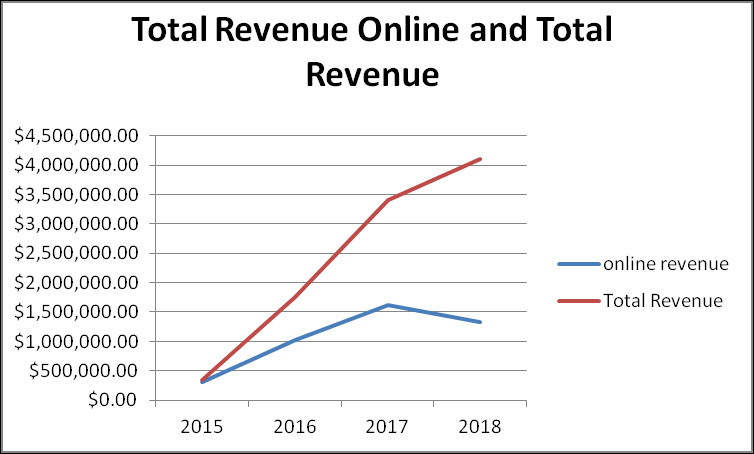
Hotels on our system have the ability to use the system as a property management system or just use it to manage their rates and availability on their website and online channels. This means that all of the bookings online come through our system, if they are also using it as a property management systems they will also be entering their walk in guests, email reservations, and telephone reservations. This charge is a comparison of all reservation revenue for all over the hotels that we work with both online and offline reservations vs. total revenue only for online reservations. As the number of hotels on our system has grown so has the revenue but you will see on the next slide that the revenue per hotel has grown also creating more value for the hotel and also showing the growth of online booking business in General.
What we can garner from this chart though is that online reservations have been increasing for the hotels up until 2017 and then dropped slightly in 2018. The overall revenue for hotels continued to increase through 2018 but did not climb as sharp. In the last 4 years 2017 has been the best year for hotels in our network and data set.
Total Revenue Per Hotel vs. Online Revenue Per hotel
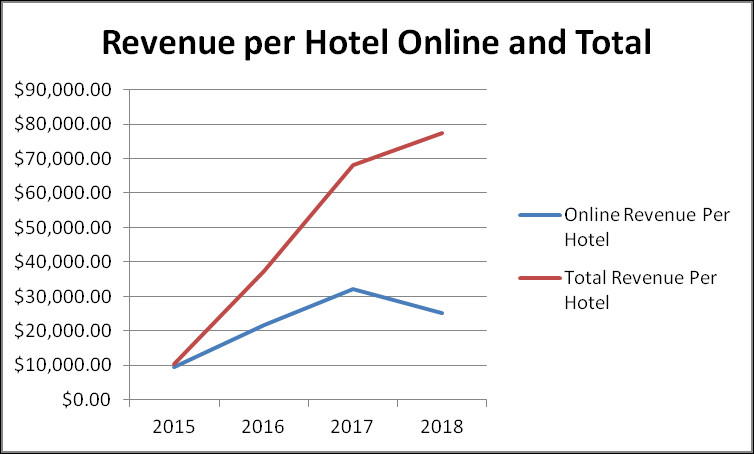
Like the first chart this is comparing online revenue with total revenue including offline bookings. The difference is that this is averaged per hotel. This shows us that each hotel on our system is increasing revenue throughout time both for online and offline bookings. We can deduct two possible reasons for this. One is that the online booking market for hotels is growing, and that hotels are starting to put more and more of their business into the property management system so we are catching more of those numbers in our reports. Two that hotels are increasing their online marketing efforts and capturing more bookings, both online and offline.
Hotel Revenue Per Hotel by Booking Source
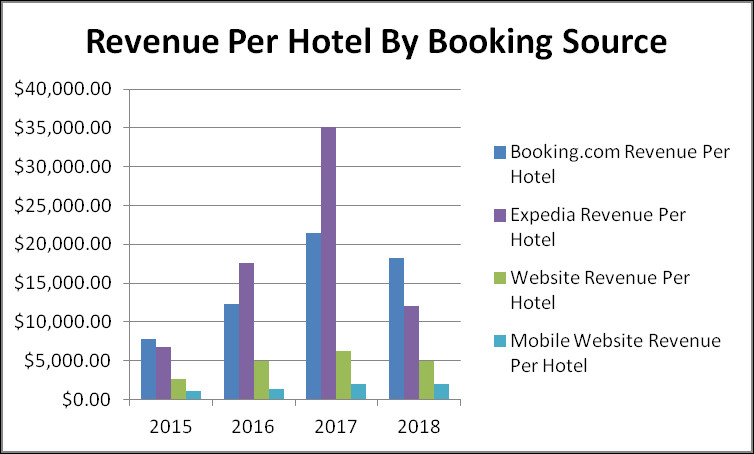
This chart shows on average across our network the revenue per source for each year. It shows the war that is going on between booking.com and expdia, along with how important the mobile website and website are in the equation on online marketing for a hotel. It does show that revenues fro website and mobile website are increasing year by year also meaning hotels are getting more and more commission free direct bookings as the market grows. Where website bookings dropped in 2018 along with expedia and booking.com, mobile bookings stayed consistent and grew a little bit. Mobile used to be a good platform for users to explore hotels available, and view media and photos in regards to the hotel but consumers usually still went to desktop to book. This trend is slowly being replaced by more and more bookings on mobile websites.
Average Booking Value Per Booking by Source
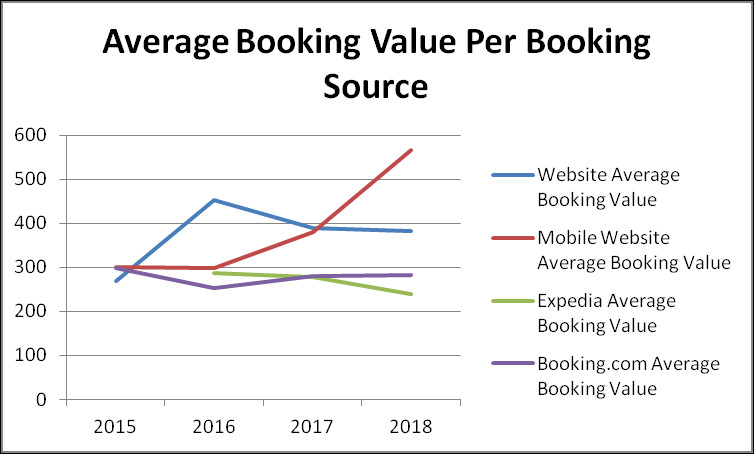
This graph shows an important distinction between Online Travel Agents and Direct booking sources. Where our last slides showed that the online travel agencies did both more volume and more total revenue for hotels than website and mobile website. You can see here that both website and mobile website provide greater booking values than both expedia and booking.com. And these values are growing each year for mobile bookings.
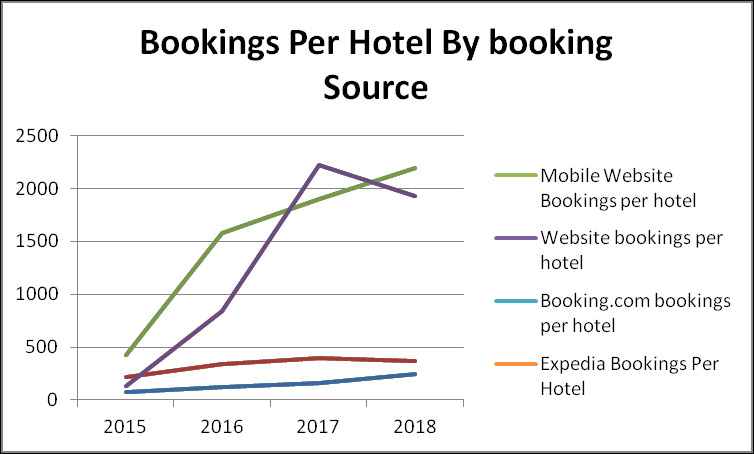
Number of Booking per Hotel by Source
Booking.com has consistently been the heavy weight in online bookings for hotels. In the last few years Expedia has been making a big push and in 2017 they actually passed booking.com up temporarily.
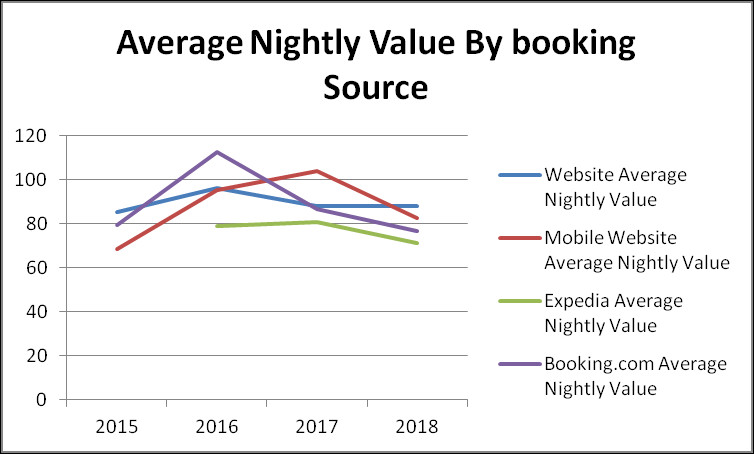
Average Nightly Value By Booking Source
It is also important to note like the Average Booking Value, the Average Nightly value is higher than the online travel agencies for both the website and the mobile website.
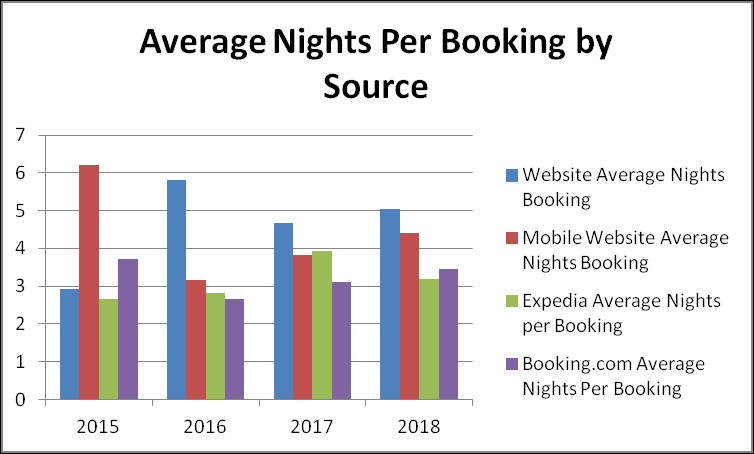
Average Nights Per Booking by Source
As a hotel owner don’t you love long stays? Guaranteed occupancy and less turn over on the room. This graph shows once again that our websites booking engines, and mobile websites out perform the online travel agencies in length of stay also. If your website does not provide live booking it is time you consider it.
Project Details
- In providing digital marketing solutions to hotels since 2004 we have collected a lot of data in our system across the hotels that we work with. This data can be very useful in deciding how to spend marketing money and measuring the return on income. If you are interested in the actual data sets or more information about this research and potentially other applications we would be happy to talk to you about it.


